
I was recently asked to find a way to perform some simple data analytics across some data within D365FO. In my case, this was audit data that could easily be millions of records so just exporting to an Excel file to do this was not really an option. Instead I wanted to build a simple form that would perform the analysis for me.
Note: This could also be done very easily within a full data analytics tool like Power BI
Requirements
In our scenario I had audit data that included a table name of the table impacted by the change and user id of the user who made the change as well as a timestamp of when the change occurred.
1) Wanted to do a count of these two columns to get a ‘number of records by table’ and ‘number of records by user’ output
2) Wanted to be able to apply date filtering to be able to say during this time range here are the number of changes that occurred for each output
Design
Normal QueryBuildRange operations don’t really accomplish what we are trying to do above, as we don’t really want to filter the data. Instead what we would really want to do is write a SELECT statement to do a GROUP BY and use that as the data source. The available options to do something like this are to use temporary tables, either an in-memory table or a tempdb table.
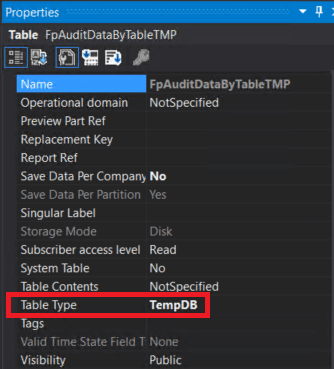
1) I started by creating two temporary tables, these tables included a name column (of the user or table) and a count column to show the count of the records of this type. To create the temp table, I created a table object in X++ and then changed the Table Type to TempDB
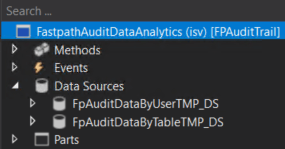
2) I then created a new form and added both temp tables as data sources
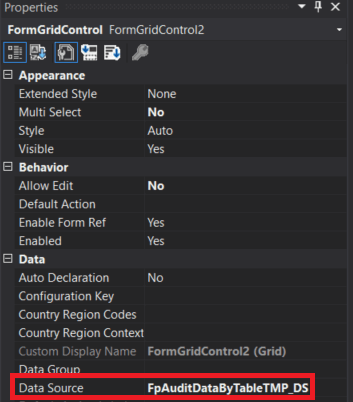
3) On the form, I wanted to create two grids one for each tempdb. For each grid object, I set the data source as the form datasource from the previous step
4) Next I modified the form code, there are a couple
- In the init() method, be sure to set the datasource linkPhysicalTableInstance() as an instance of the temp table
- In the executeQuery() method, there are a couple points:
- Remove all data from the temp table
- Created a SELECT statement to perform the GROUP BY function on the data fields, including the start and end dates from the date filter on the form
- Insert the aggregated records into the temp table

5) On the form I created a start/end date time fields, so I wanted the grids to update based on any changes to those fields. By doing this any time either the start or end dates were updated the executeQuery() function from both
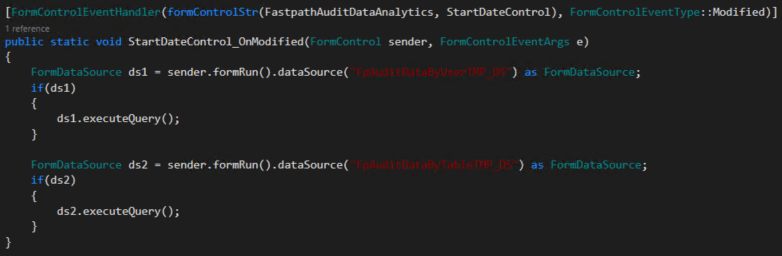
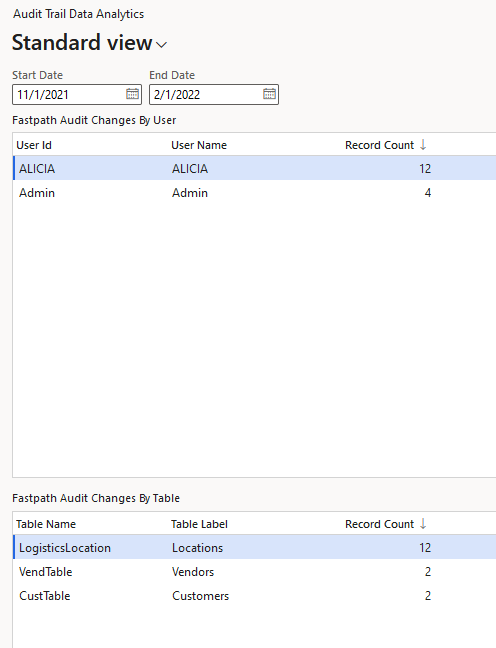
6) The final result looks like the form below, it includes a start and end date fields that control the records in the grids which show the ‘changes by user’ and ‘changes by table’ record counts.
Conclusion
The above process shows how you can use temp tables to perform simple data analytics and utilize it as a data source for a grid.
can you please tell when/where to declare the tmp_adt in your code.
Apratim,
This is a good call out, the screenshot does not capture this.
The tmp_adt variable is an instance of the FPAuditDataByTableTMP temporary table which includes the following columns:
– TableName
– TableLabel
– RecordCount
Hi Alex
are you able to share the source code of the complete solution please?
Edy,
Unfortunately I cannot as this was part of a larger solution I developed for a previous employer. I can however help if you have specific questions about implementing this.
Hi Alex,
Thanks for the response.
I put the [Datasource] inside the final class of the form extension, is this correct?
I try to explicitly call the executeQuery() method on Tab Page activation but nothing happens. I tried to step into the ds1.executeQuery() but cannot step into.. Nothing happens..
————-
public static void TBG_Configuration_OnPageActivated(FormControl sender, FormControlEventArgs e)
{
FormDataSource ds1 = sender.formRun().dataSource(“TBG_DeviceConfigurationTmp_DS”) as FormDataSource;
ds1.executeQuery();
}
—————
[ExtensionOf(formStr(SalesQuotationTable))]
final class SalesQuotationTableForm_Extension
{
private TBG_DeviceConfigurationTmp tbgTmp;
[DataSource]
class TBG_DeviceConfigurationTmp_DS
{
public void init()
{
super();
TBG_DeviceConfigurationTmp_DS.linkPhysicalTableInstance(tbgTmp);
}
public void executeQuery()
{
tbgTmp.ItemId = “88.12”;
tbgTmp.Name = “Test”;
tbgTmp.insert();
info(“Hello Configuration 3”);
super();
}
}
}
Edy,
There should be no need to explicitly call the executeQuery method as if this data source is tied to a grid then it will automatically get called during the form load (declaring the temp table as a data source for the form and setting it as a data source for a UI element, like a grid for example).
In my case I created a new form to show the values, but this should also work for a form extension:
[Form]
public class AnalyticsForm extends FormRun
{
DataSourceTMP_DS tmp;
[DataSource]
class DataSourceTMP_DS
{
public void init()
{
super();
DataSourceTMP_DS.linkPhysicalTableInstance(tmp);
}
public void executeQuery()
{
//Query to fill ‘tmp’ table
super();
}
}
}
Hi Alex,
Thanks for the response.
I put the [Datasource] inside the final class of the form extension, is this correct?
I try to explicitly call the executeQuery() method on Tab Page activation but nothing happens. I tried to step into the ds1.executeQuery() but cannot step into.. Nothing happens..
I am trying to extend the salesquotationtable form by adding a tab with a grid linked to a temp table
Thanks Alex.
Sorry for sending multiple comments cause they disappeared on this page after I sent it. I thought its been cancelled.
If I solve my problem, I will post the solution here.
Ideally the business logic to insert the data into temp table shouldn’t be there in executequery. for every refresh, it will start loading the data.
Gururaj,
You are correct that you could offload this to a background batch job or provide an ‘Update Data’ button on the form itself if you are wanting to avoid the data load within the executeQuery() method.
Alex,
I have a form with following functionality
The form has 5 data sources with TempDB tables which are not joined to each other. The data source data is displayed on 5 separate grids.
When the form opens, the data needs to be populated on the form. There is a custom Save button and clicking on it, data needs to be copied from all of these individual data source and stored in a seperate regular table one for each of these tempdb datasources. The save can happen multiple times and data can be stored in the table for every new version which is unique by a number.
there is another form control with drop down on these versions. when a user picks a specific version the data needs to be loaded on the form for that specific version.
I am adding code to populate the temp table on modified event and calling research method. But the data on the form does not reflect on what I populate in code, eventhough I populate the datasource for that specific version.
[DataSource]
class ProdOrderTmp
{
///
///
///
public void init()
{
if (rev)
{
this.loadProdOrderTmp();
}
super();
}
//When form opens load the temp table grid from saved data
public void loadProdOrderTmp()
{
ProdOrderTmp prodOrdersTmp;
Prodorders prodorders;
while select prodorders
{
prodOrdersTmp.clear();
prodOrdersTmp.Rev = prodorders.Rev;
prodOrdersTmp.ProdId = prodorders.ProdId;
prodOrdersTmp.Description = prodorders.Description;
prodOrdersTmp.insert();
}
ProdOrderTmp.linkPhysicalTableInstance(prodOrdersTmp);
}
public void executeQuery()
{
delete_from prodOrdersTmp;
while select prodorders
where prodorders.rev == rev
{
prodOrdersTmp.clear();
prodOrdersTmp.Rev = prodorders.Rev;
prodOrdersTmp.ProdId = prodorders.ProdId;
prodOrdersTmp.Description = prodorders.Description;
prodOrdersTmp.insert();
}
super();
}
on the Form control, here is the parameter field. When the field value changes,
the data on form grid should change accordingly. i,e clear the grid and update
with data related to the parameter
public boolean modified()
{
boolean ret;
ret = super();
rev = this.value();
ProdOrderTmp_ds.executeQuery();
return ret;
}
Srikanth,
Couple quick questions:
1) Have you added this temp table as a datasource on your form itself?
2) What happens when you step through while debugging the form? Does the temp table populate logic actually execute?