
When writing code there is many times when developers have to make a choice between the ‘easy route’ and the ‘correct route’. The decisions made while writing code can have huge impacts down the road about code readability, maintainability, and extensibility. When writing code for personal projects this may not be that big of concern but when writing them for enterprise applications (especially as part of a larger team) it is imperative that certain coding rules and best practices are followed.
How do we go about enforcing these rules? How do we go about analyzing current code for issues? What tools are available to help with this process?
What is NDepend?
NDepend is tool that can integrate with Visual Studio (as an extension) and other source control systems (Azure DevOps/TFS) that allows you to analyze your code for issues and to give you view points into your code you didn’t even know existed.
How to add NDepend to a Visual Studio Project
After installing the extension, you will have the option to analyze an open project. In my case, I wanted to run it against a larger .NET project I had access to. It was able to quickly find assess which assemblies it should be ran against and automatically filtered out any ‘test’ assemblies.
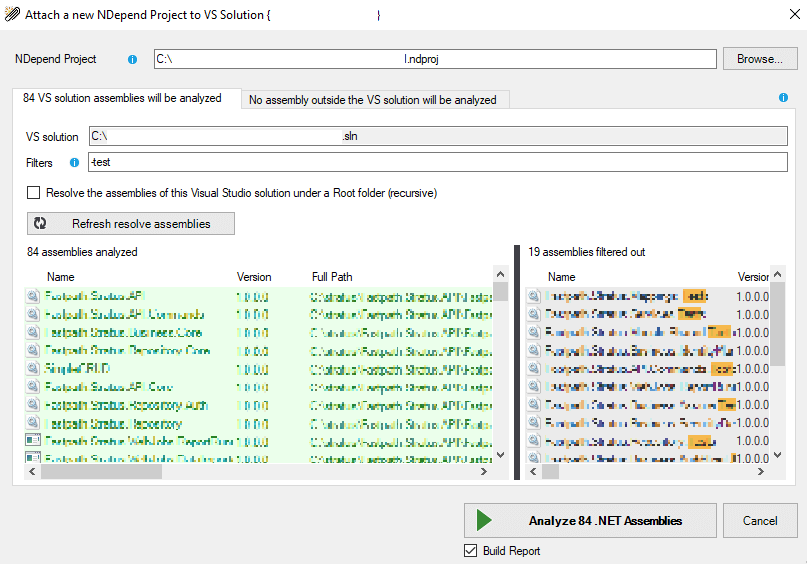
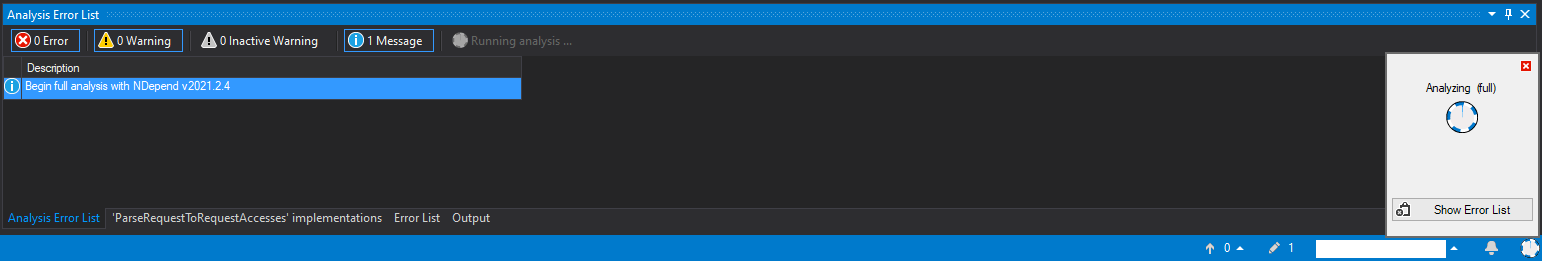
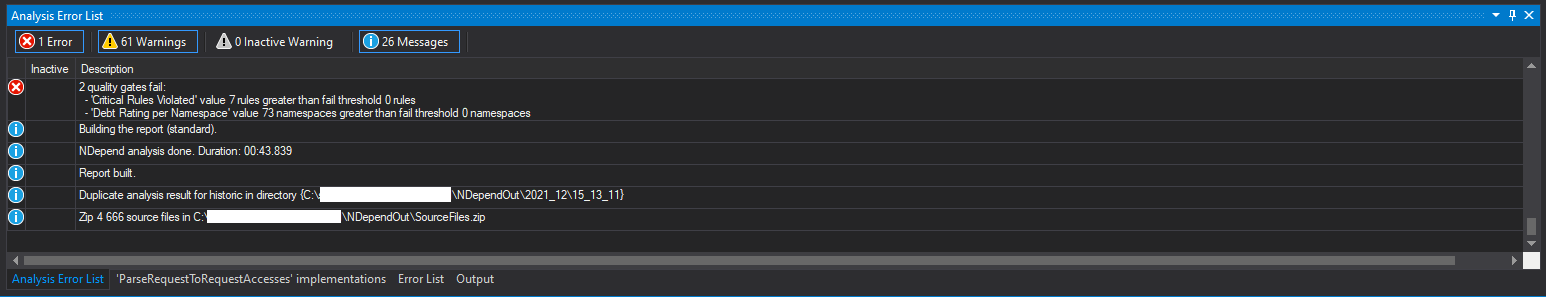
The analysis took under 45 seconds to analyze all of the assemblies which in my opinion was extremely impressive.
NDepend Analysis
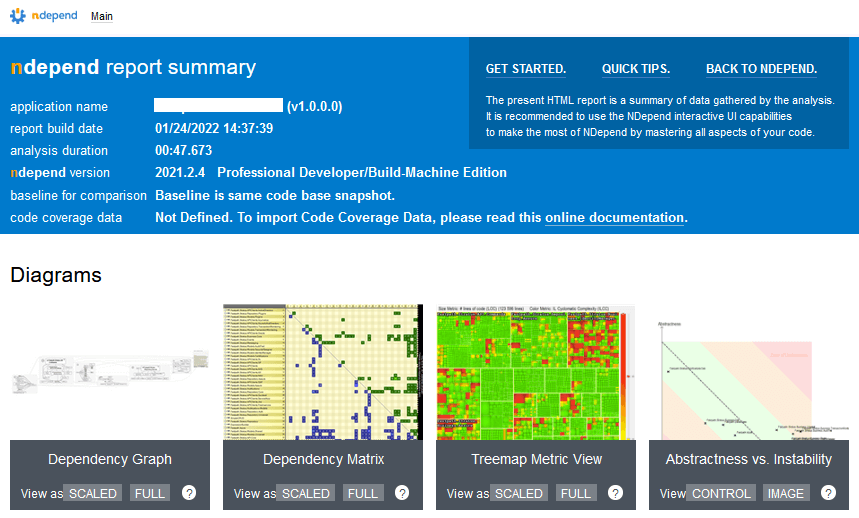
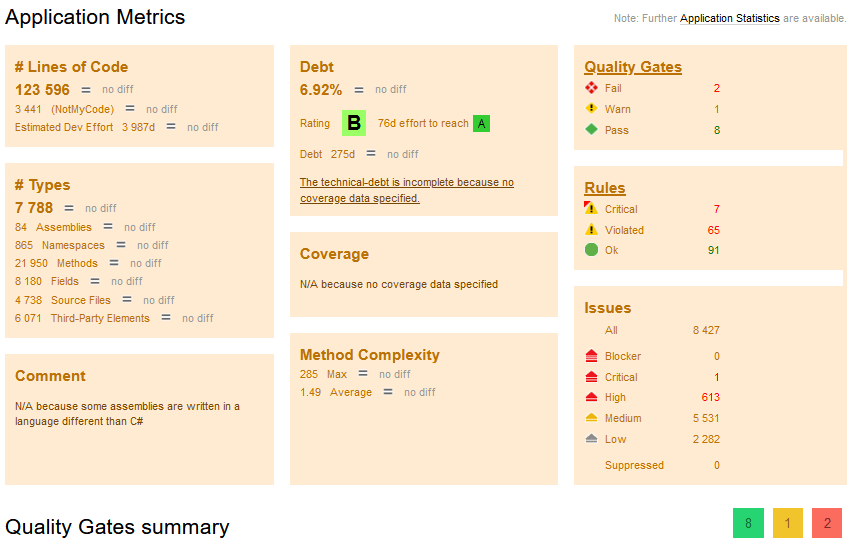
Once the analysis was complete, a dashboard was created that gave an overview of the code in question. As you can see a lot of different metrics were ran against the solution. The initial analysis can be slightly overwhelming but luckily there are numerous NDepend guides online as well as helpful hints in the product to help with understand what each part was referring to.
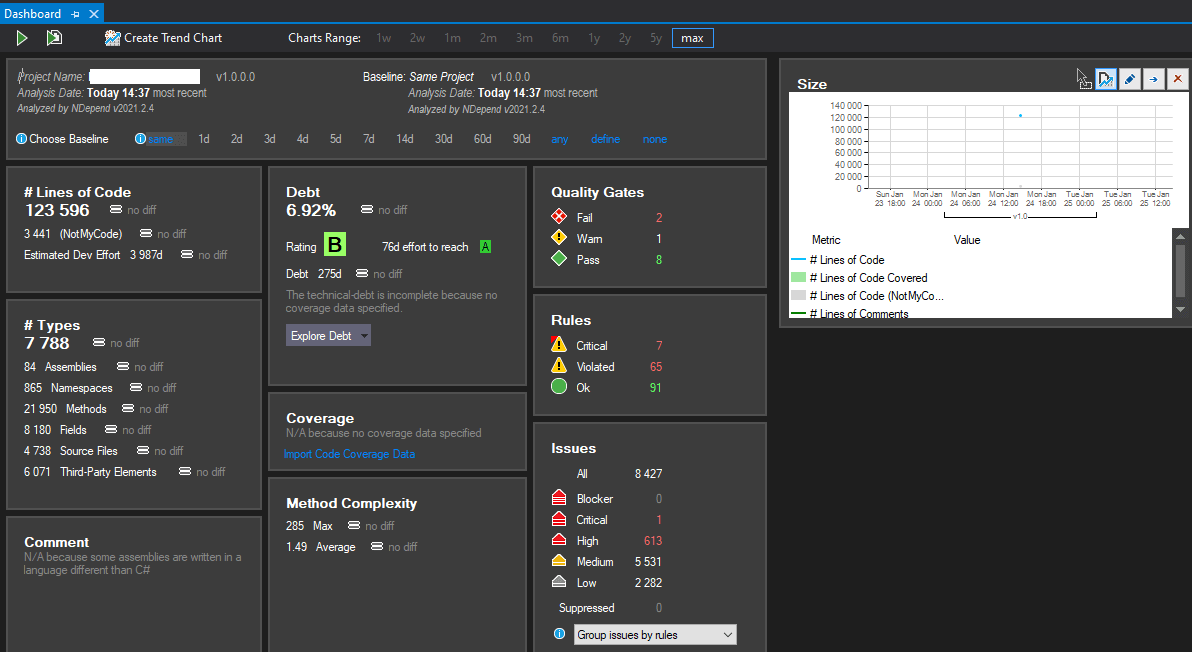
One really cool feature here is that the analysis overview is presented within Visual Studio as well as outputted in HTML format for consumption there as well.
Heat Maps
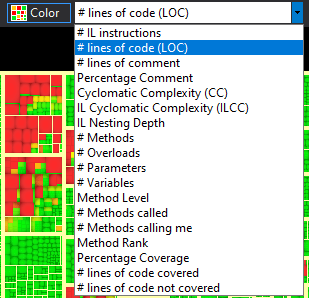
One of my favorite features of the tool was the ‘heat maps’ they were able to generate which allowed you to see where in your code certain criteria are met. This map is fully interactive and you can zoom in and out and double click to open the code in question.
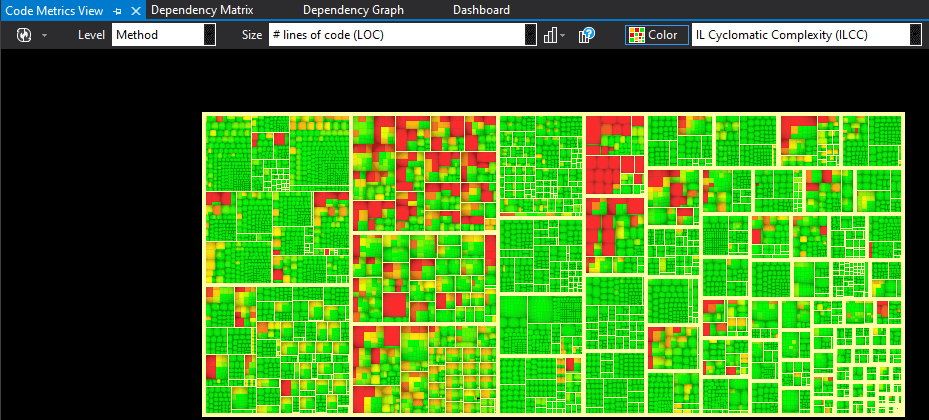
You can change the parameters of what the heat map is showing you as well.
Dependency Graph
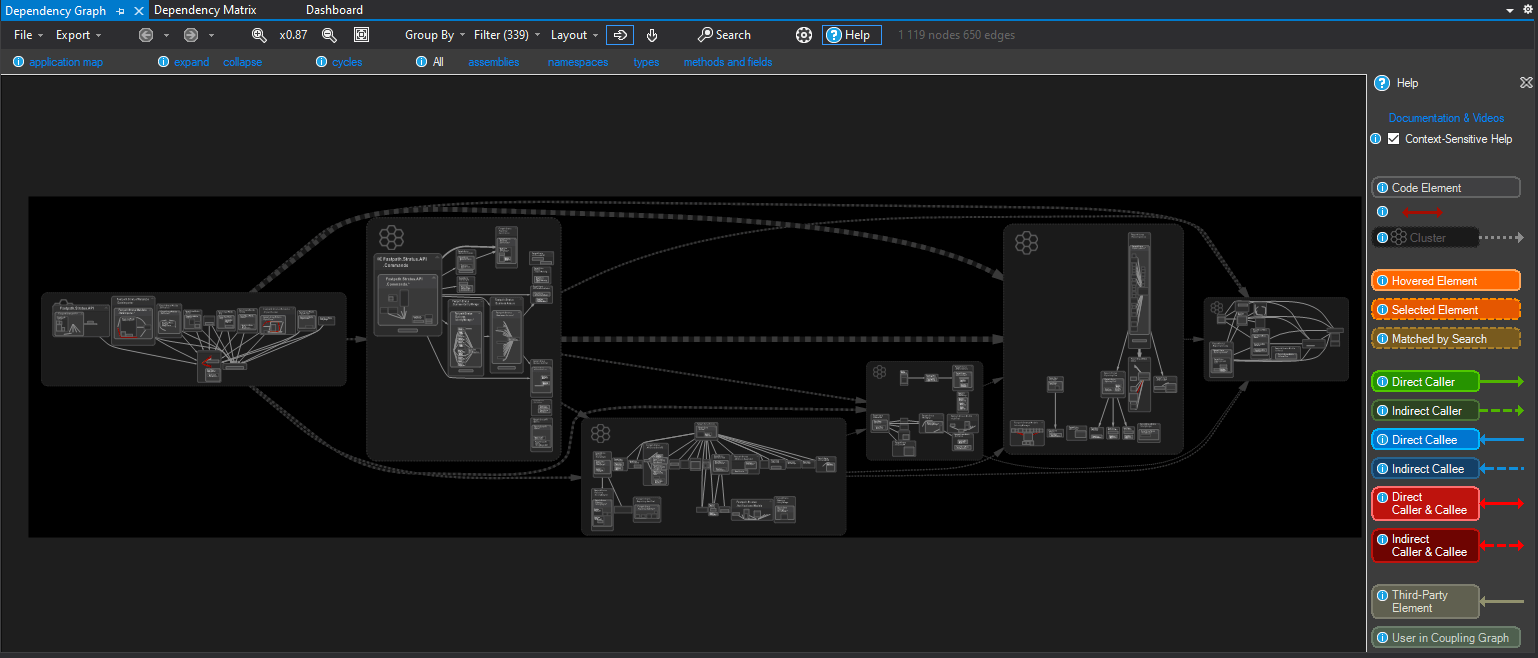
Another feature that can be extremely helpful is the dependency graph which shows all of the dependencies that exist in your solution. This view is also interactive and allows you to zoom in and out to find different areas of your code.
Code Searches and Queries
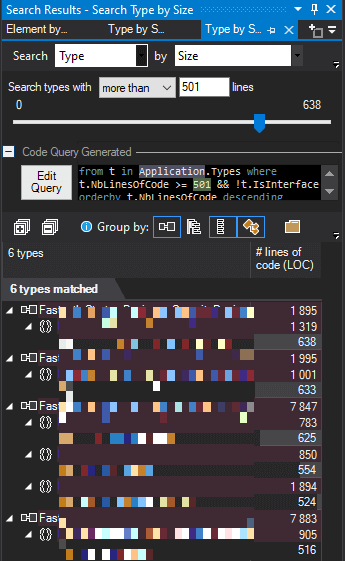
One of the features that I found most helpful was the searching and querying portion of which allows you to use out of box queries or even modify them and create your own to find areas of your solution that meet a certain criteria. In the example below, I was finding files that had more than 501 lines of code. As with all other metrics, this again is interactive and you can double click to jump to the file in your solution.
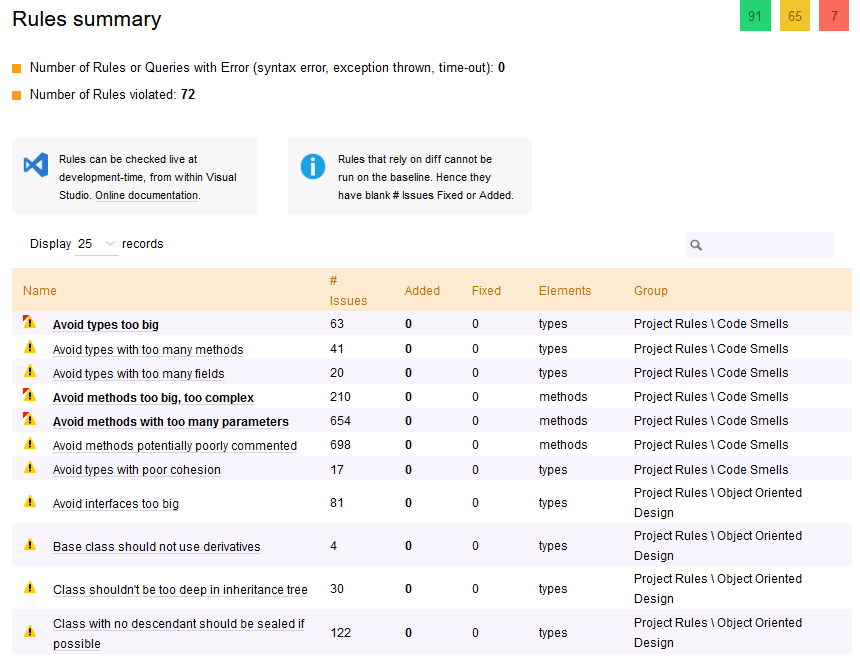
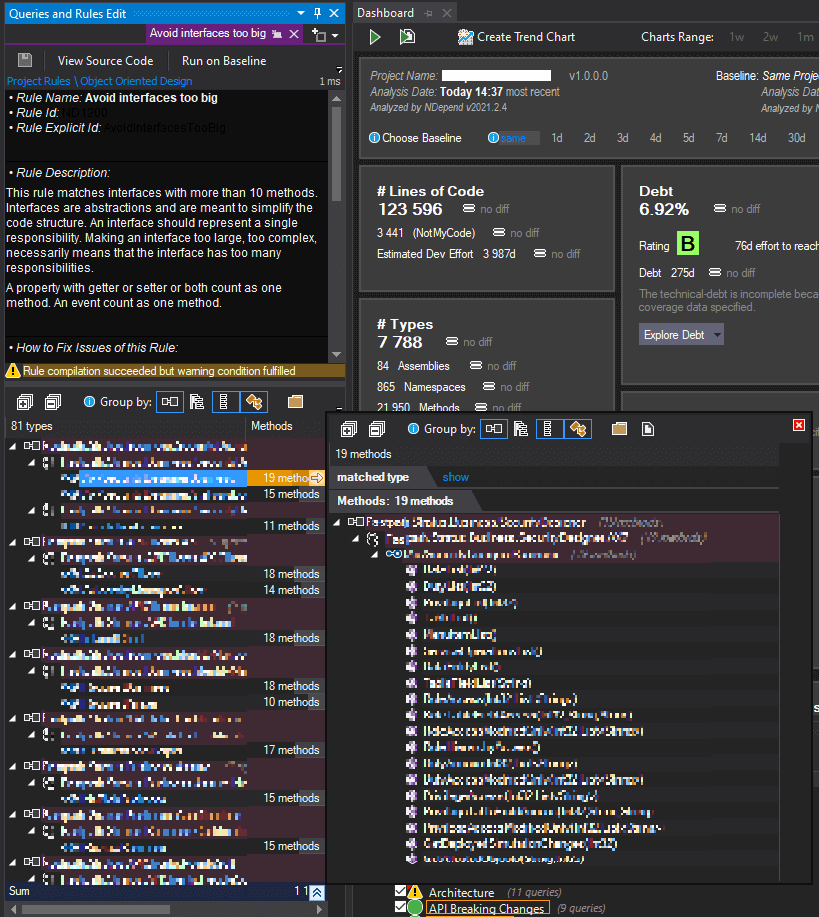
The other part to searching is the code rules / best practices you would like to enforce. There are quite a few that exist out of the box and then you can take and modify them to fit your particular business needs. For example, here are some of the out of box rules that are available broken out by category.
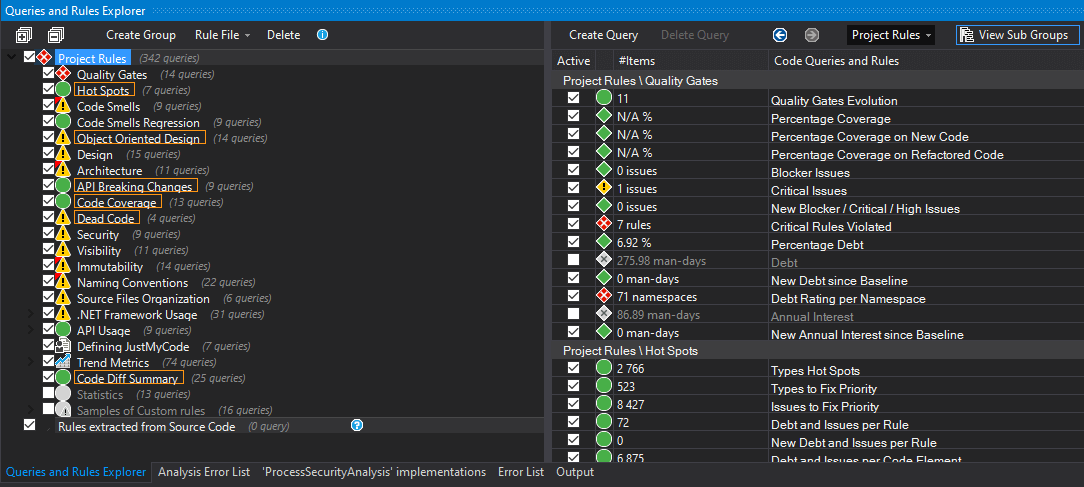
You can also open any of these rules to get more information about the rule itself and where it has been violated in your solution.
Conclusion
NDepend is a tool that gives in-depth analytics of your code base, it is useful as a single developer as well as on teams. The amount of data and insights it provides can be overwhelming at first, so I would recommend trying to focus on certain areas that you think would be the most beneficial at first. I could see this being very beneficial for someone who is in charge of keeping a coding standard / best practice.
Disclaimer
I was given a year-long single user license to evaluate NDepend in exchange for writing this review. This post is not paid or sponsored by NDepend and the opinions expressed above are my own.