Recently Microsoft released a GitHub repo that extends the functionality of the current ‘Monitoring and Telemetry’ functionality called ‘ISM Telemetry for Finance and Operations’.
Let’s take a look at what this is and what features it offers.
Installation / Configuration
The instructions on the GitHub repo are pretty thorough, I will just point out a couple things:
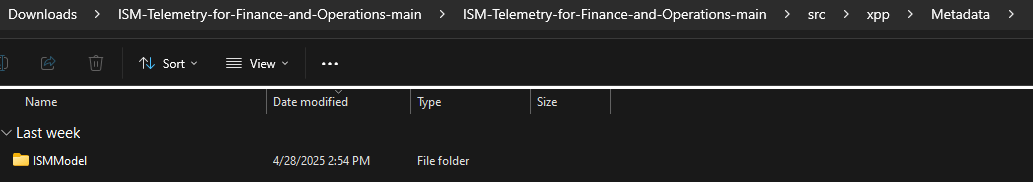
1) When you download / clone the GitHub repo it contains the model you need to add to your environment at the following location:
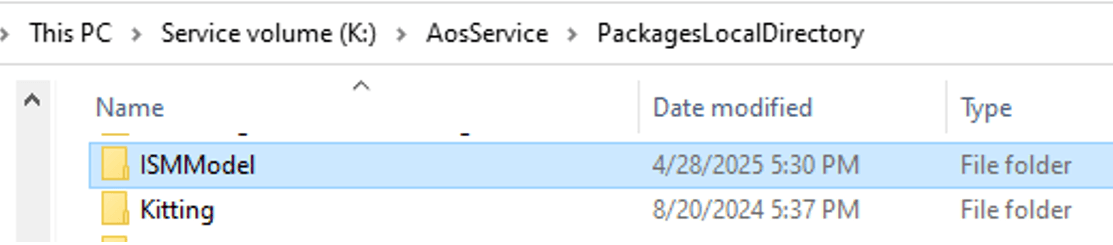
This will need to be copied to your ‘PackagesLocalDirectory’ folder:
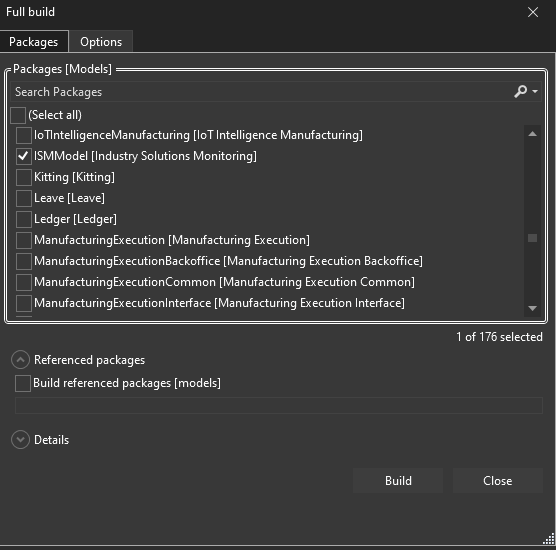
2) Once copied, be sure to ‘Refresh Models’, and then build the ‘ISMModel’ model as well as perform a full database sync.
Once this is completed, the new functionality is ready to use.
Feature Usage
The only UI change you will notice after installing the model is an additional configuration setting in the ‘Monitoring and Telemetry Parameters’ page:
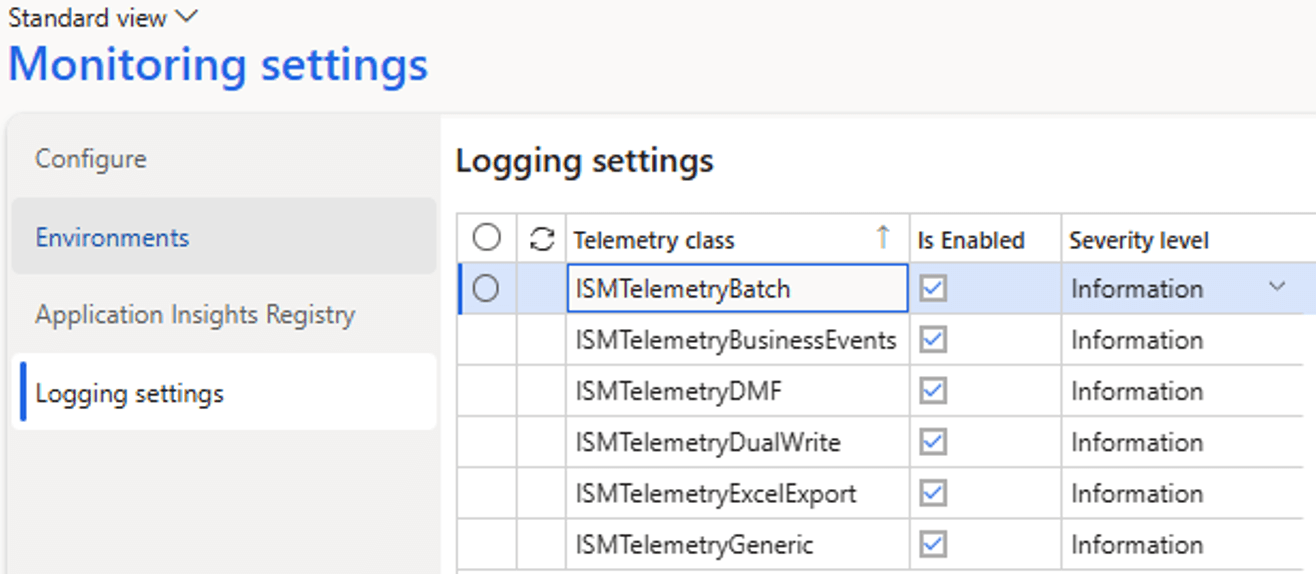
This lists out the additional telemetry data classes we can utilize in our code, let’s see how we can use these.
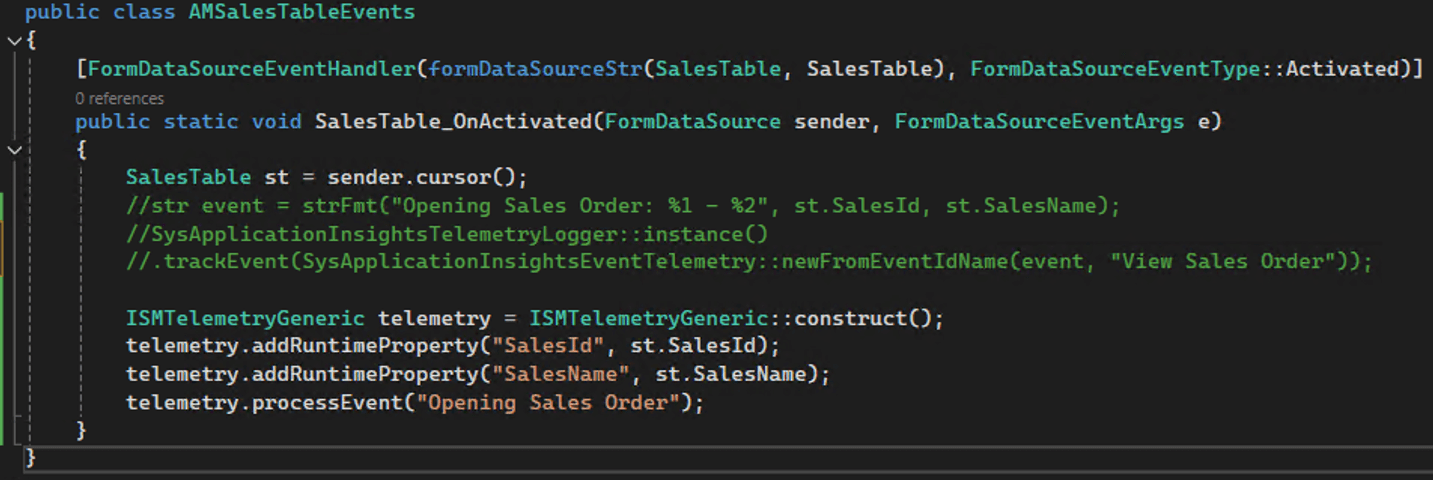
In a previous blog post I showed how you could create a custom telemetry data event to track when a sales order was opened. One downside to this approach was that the entire event string was stored in one parameter which made querying for this data slightly tricky.
Using the ISMTelemetryGeneric class we can now utilize the ‘addRuntimeProperty’ to add additional standalone properties to the telemetry data we capture. You can see in the example below, I commented out the old code and added in our new code which allows me to add a ‘SalesId’ and ‘SalesName’ parameter. I can then call the ‘processEvent’ method to actually log this telemetry data event:
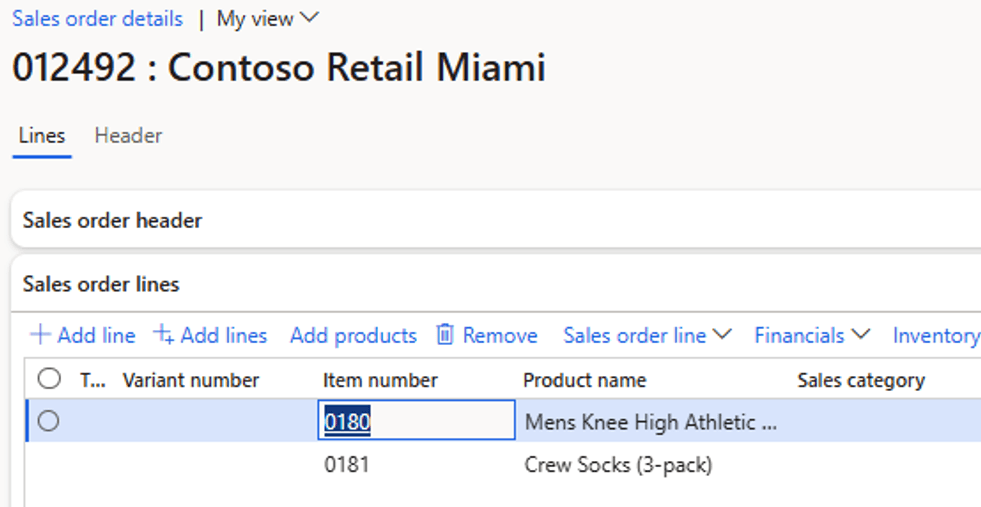
Now if I go and open a sales order and view the lines:
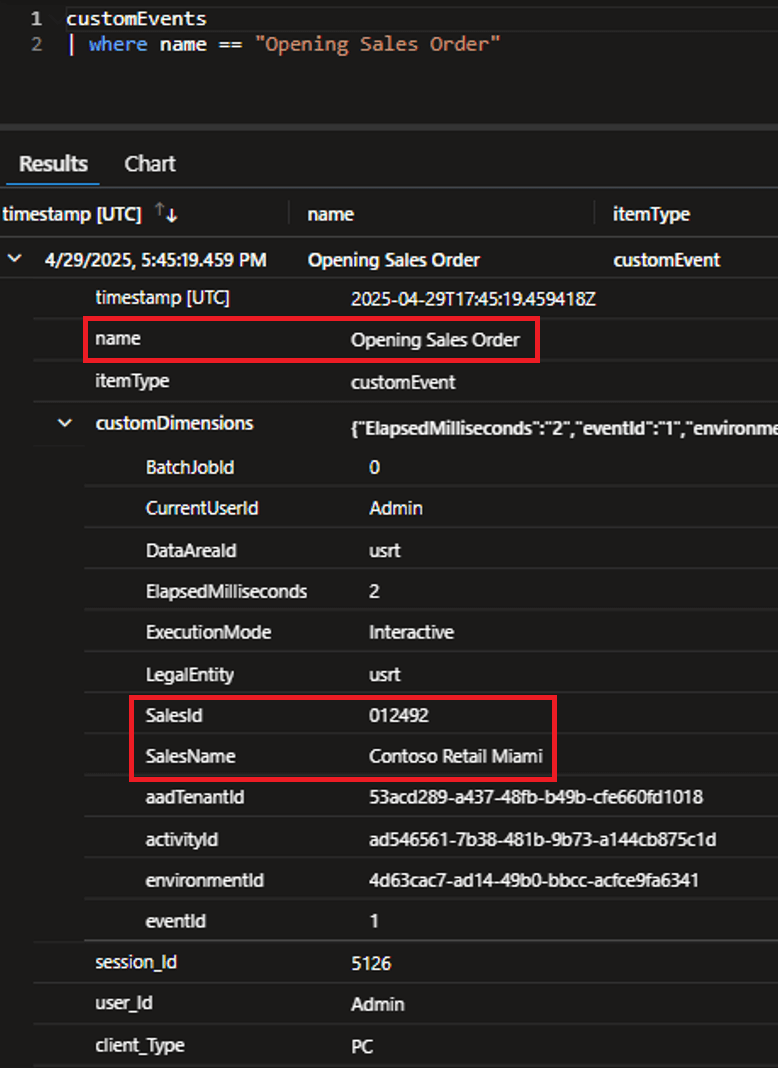
We can see the event being logged in my ‘customEvents’ AppInsights container, and we can see the parameters are now part of the ‘customDimensions’ JSON string as distinct properties that would be queryable:
Azure Data Explorer
The documentation within this GitHub repo also showed an additional option for visualizing and querying this data by ingesting the data into Azure Data Explorer. This tool is a data platform designed for high-performance big data analytics that supports querying, visualization, and data management.
This can be done by navigating to https://dataexplorer.azure.com/, if this is your first time navigating here you will be asked to create a new dashboard:
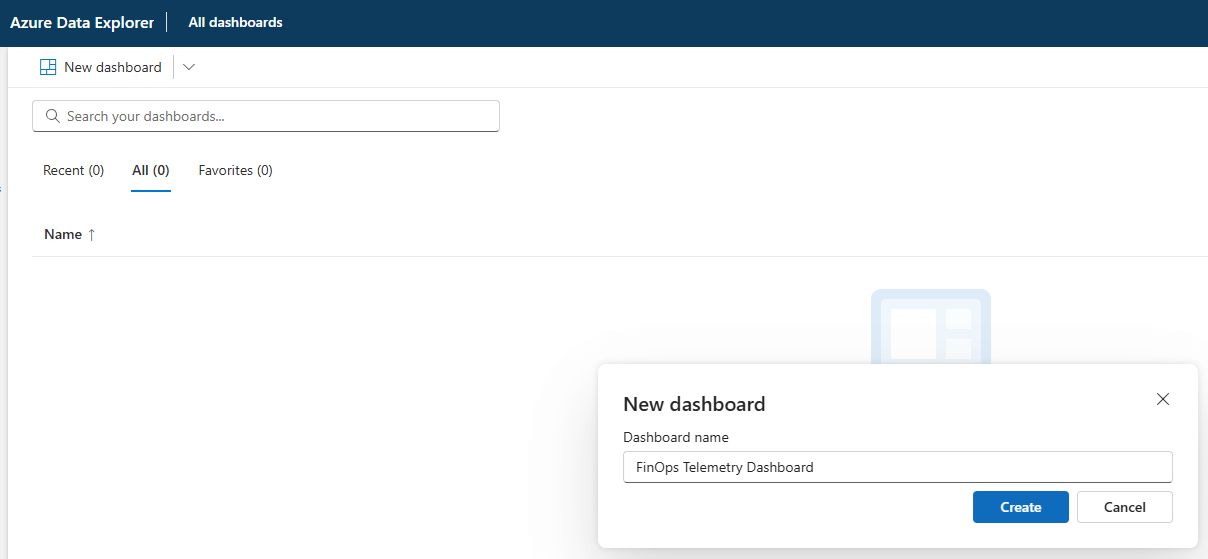
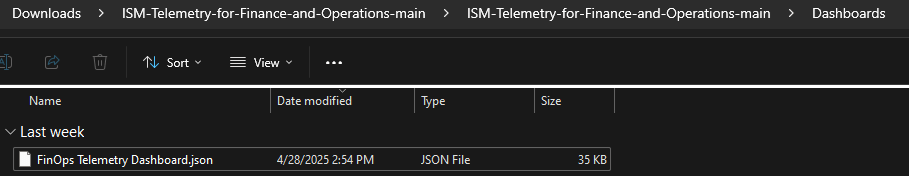
You then can import a pre-made dashboard file found in the already downloaded GitHub repo:
Once imported, you can modify the data source of this dashboard, the main value we need to change is the ‘Cluster URI’. We need this to point to our App Insights container that has our telemetry data:
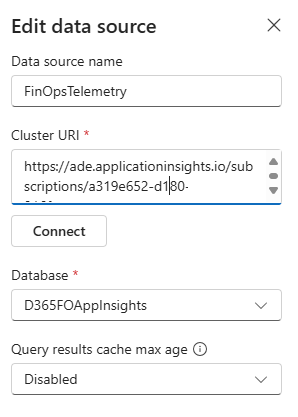
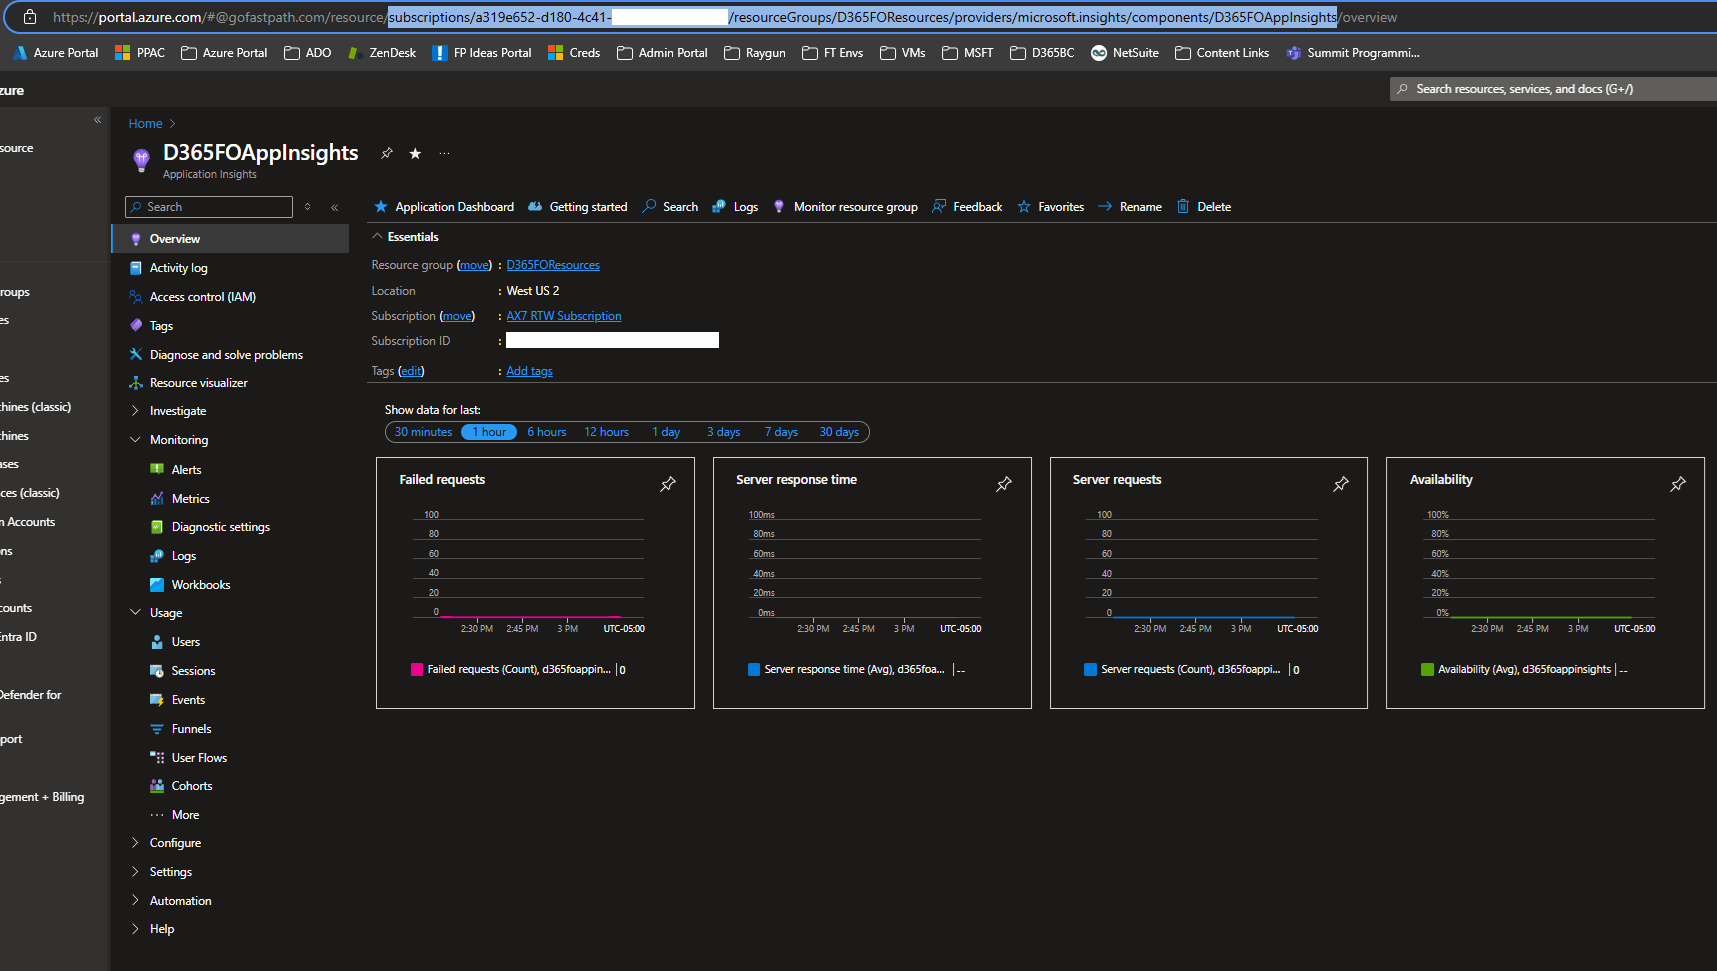
The easiest way to provide the correct string is to navigate to your App Insights resource in Azure Portal and copy the URL from ‘/subscriptions/…’ to the name of your App Insights resource, in my case ‘D365FOAppInsights’ and paste this into the Cluster URI parameter leaving the ‘https://ade.applicationinsights.io’ prefix.
Once updated, you will be able to select your ‘Environment ID’ which dictates which D365FSC instance you are gathering data for. Once these selections are completed, you will be able to start to see data being ingested from this resource:
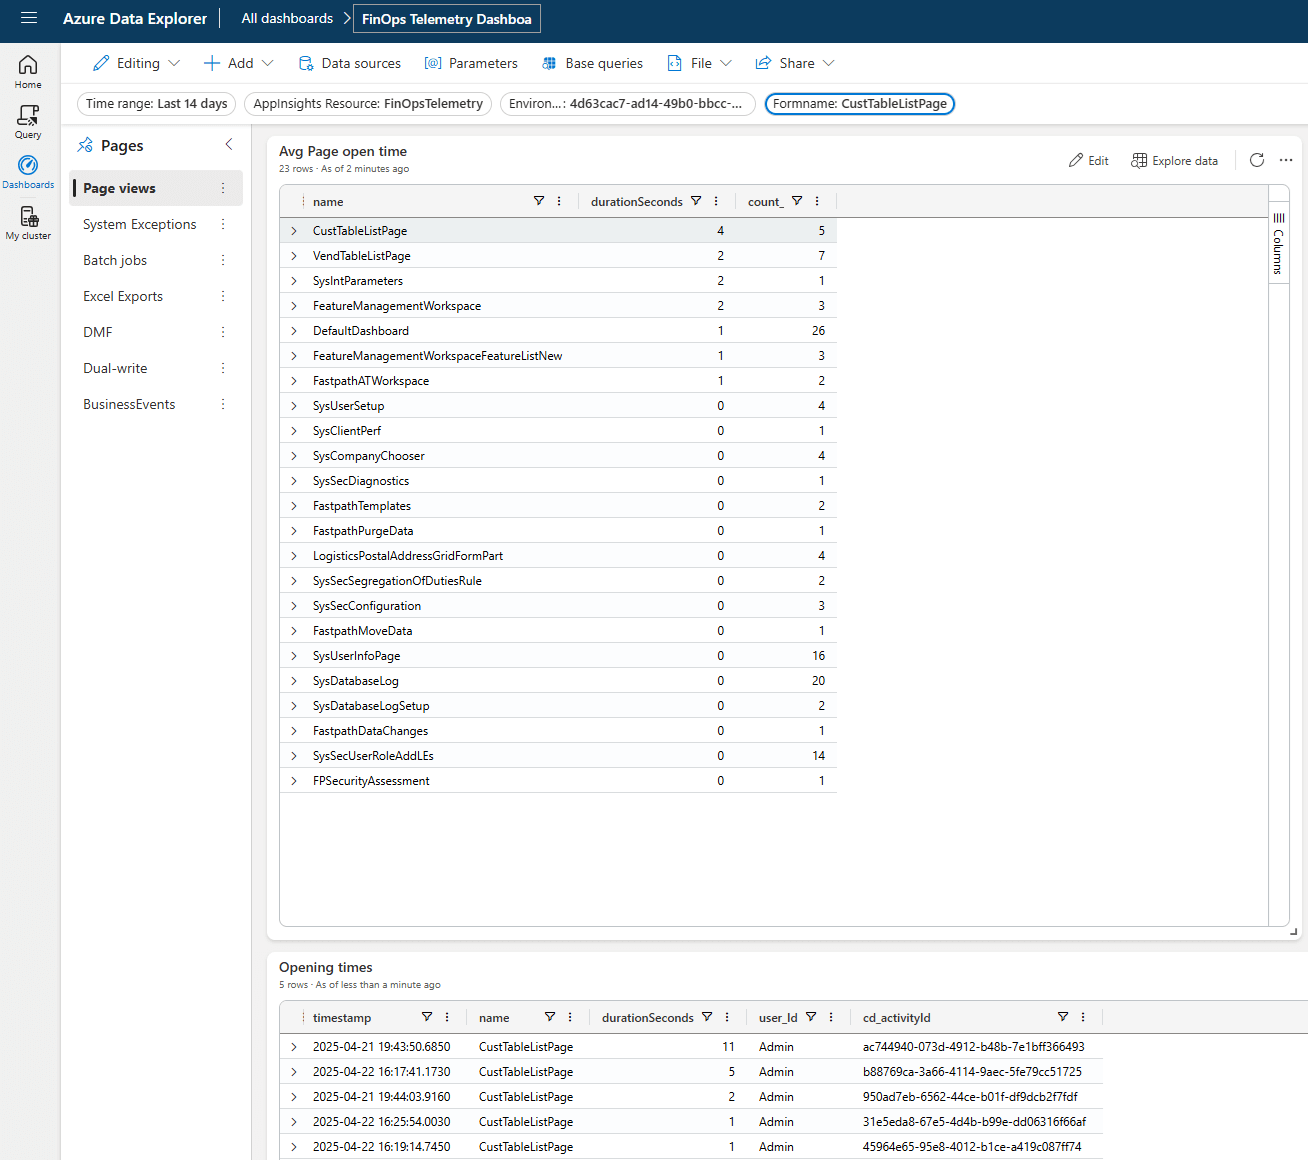
You can then start to create your own data visualizations or ’tiles’ as Azure Data Explorer calls them each with their own queries that can be modified via KQL:
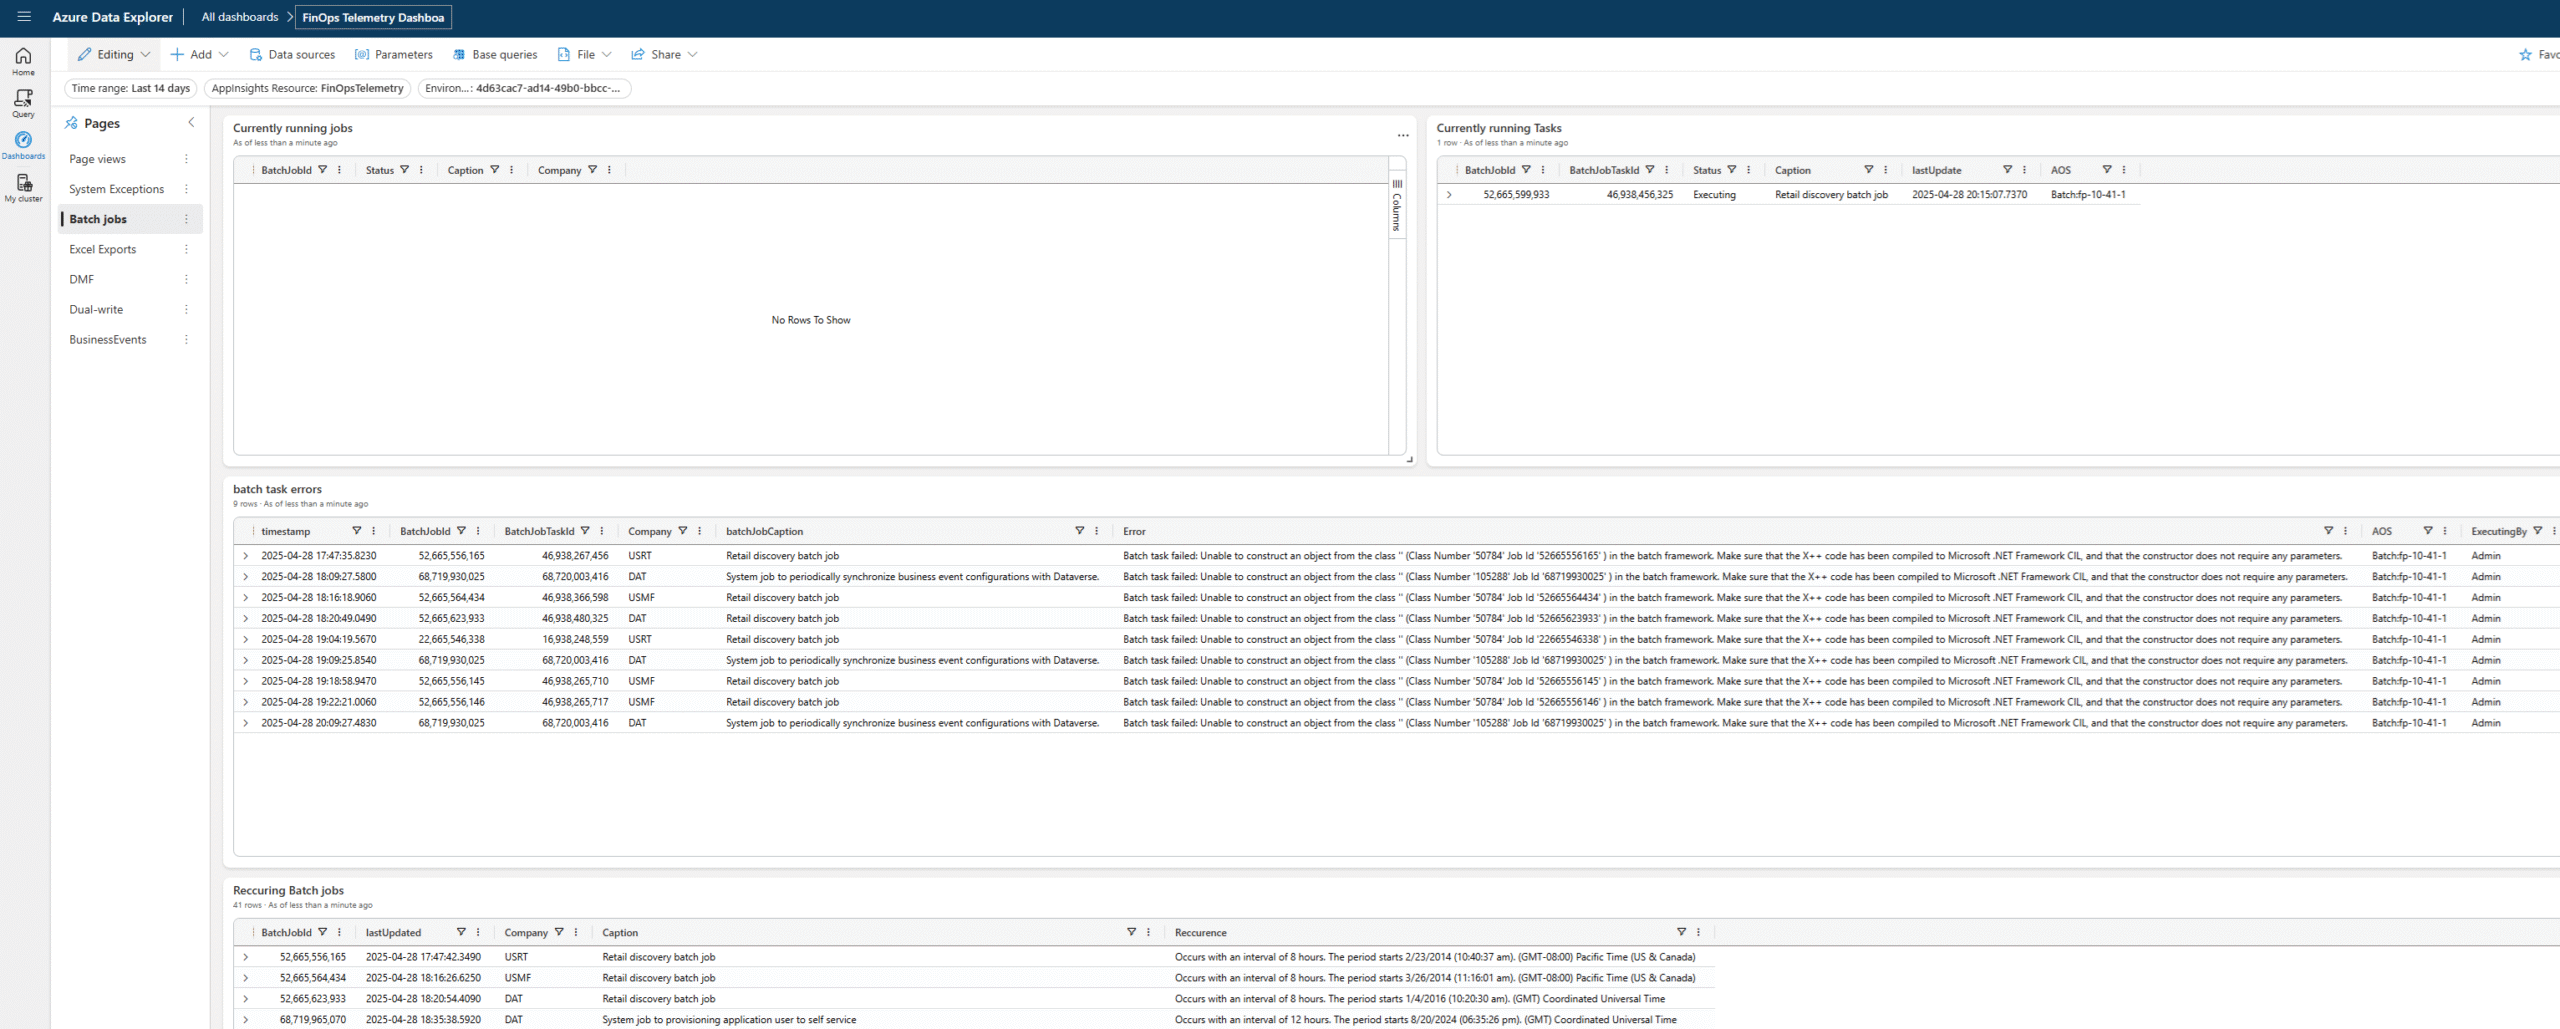
I still need to do some additional digging on what all you can utilize this functionality for but it is another way to view this telemetry data without having to grant access to Azure Portal or create another external reporting solution.
Just note that the ability to add custom dimensions (properties) isn’t something added by ISMModel. It’s supported by F&O OOTB at least since 10.0.35; addRuntimeProperty() is just a different way how to use standard objects like SysApplicationInsightsProperty class.
This is an important piece of information for people who don’t want to take dependency on ISMModel.
Martin,
Thanks for pointing this out, good to know!
Hi Alex,
We can take this solution further to create an agent
https://www.linkedin.com/feed/update/urn:li:activity:7340472113692143616?utm_source=share&utm_medium=member_desktop&rcm=ACoAAALaP88BlPzO_88QRPX2HqyAvwjBDTYedOA